Ichimoku & Donchian Channels; What are they? — Jackie Le' Tits — Video Wiki
Chart Drops 📈 (6)
The Receipts 🧾
Full transcript (3,253 words) — every glorious word
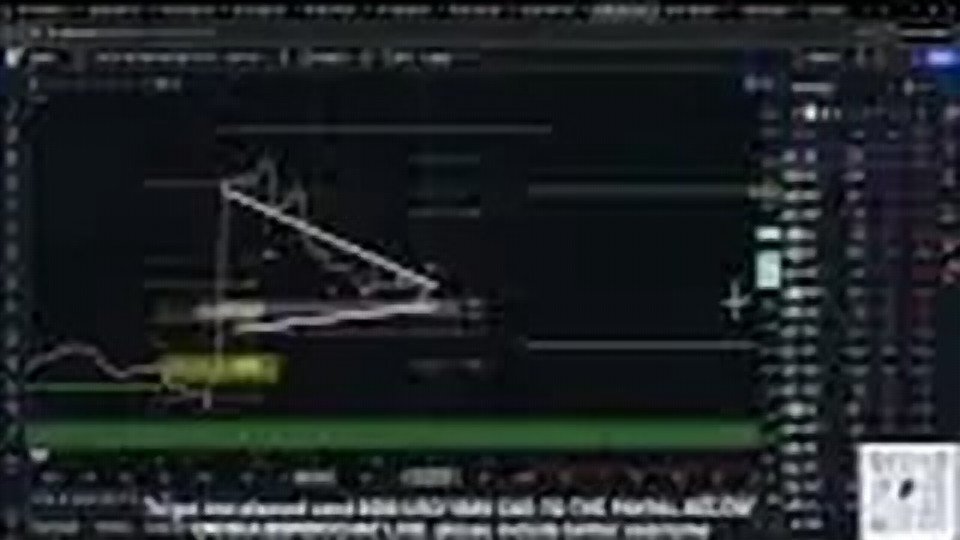
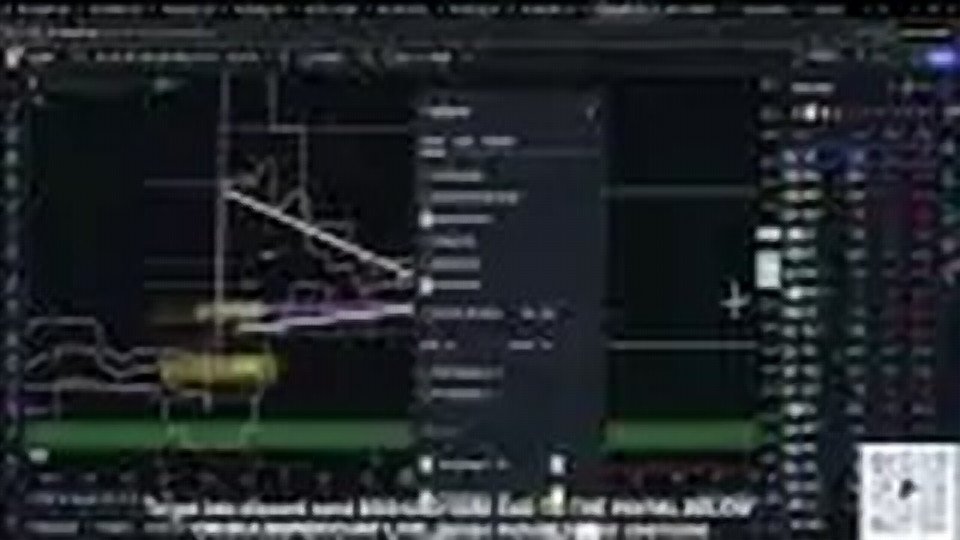
0:01so right here right in pink on the ichimoku okay we have our Baseline length this is one of the first lines that make up the ichimoku indicator okay now the reason that I show you this one first okay is because this is one of the moving averages used in ichimoku to create quote golden and death crosses okay and you can think of this like your 200 period moving average okay this is supposed to be the more stable moving average now the reason that I pulled this one up with only this line there was a reason that I wanted to show something to you guys okay check this out I'm going to turn on the Donan channels okay now this is an indicator that you have not heard a lot of people speak about before okay but we're going to turn on the donian channels these are similar to Ballinger bands okay but I want you to notice something with me okay we're going to turn these on let's see what happens okay cool interesting right interesting Donan Channel okay cool now this if I remember is that fix it there we go all right now let's turn off the ichimoku for a second whoa where did that green line come from whoa whoa whoa whoa whoa whoa whoa hey hey now what's that all about how come the ichimoku line Baseline is that the exact same place as where the Donan Channel Center Line is interesting hey isn't that kind of interesting so the Donan channels are actually an extension of ichimoku in which the center line when you have the adjusted center line on the Donan channels at 26 it can show you that same Baseline as the ichimoku line on the ichimoku cloud indicator will show you so at a glance right lots of people like to use the Donan channels over ichimoku because it basically just encapsulates price action while also having the ichimoku line here right without it actually being physically on the chart so just something kind of cool and unique that I wanted to show you guys there regarding the ichimoku and the Donan channels all right now going back to the ichimoku we talked about how this Baseline right this Baseline is basically like our 200 period moving average in that you can have death crosses and golden
2:38crosses through it now what makes up those death and golden crosses well that's your other length right here okay this is your conversion line all right this is the ichimoku conversion line and you can see how this thing is a lot more volatile and it moves a lot more more right the reason that this thing moves a lot more is because it takes into consideration Less Price action right if we open up the indicator look at the Donan Channel conversion line right it's only taking into account the last nine candles and so what we say when we use ichimoku is when you have the the the orange line right when you have the conversion line cross through and above the Baseline that is said to be a golden cross when you have it break down underneath the Baseline that is considered a death cross all right so people will use these two specific lines right very similar to how they use moving averages right the 50 and the 200 they will use these in a very very similar manner it's just that the ichimoku ones right because they take in less time right because the ichimoku uh lines take in less time into consideration right because the base line is 26 this is 200 this conversion line is N9 This Is 50 right so it's just it's like a more reactive right it's like a more reactive moving average You could argue that it's very similar to exponential moving averages right so now the other side of this indicator and why people really like the ichimoku cloud is for the clouds themselves right so you've got your your uh leading span a and leading span B it just it just puts these it just puts the clouds on the chart right the most important thing to understand about the clouds okay the most important thing that you need to understand about the clouds is the wider and larger that those clouds are the more resistance that lies above right or if you were above a large green Cloud the more support that lies underneath so when you see big fat [ __ ] red clouds It generally tends to indicate that there is heavy heavy heavy amounts of resistance above and that you are very unlikely to get through that and that just speaks to
5:14the widening range of price action right and then what these clouds do you guys can see that price is here but the cloud is all the way up here it's because it's forward looking and it's because this is taking Tak into consideration prior price action current price action and then spitting out clouds that predict uh um uh future price action and future price action when we tend to see these clouds get thinner and thinner it suggests that the range of the stock has become Tighter and Tighter and Tighter right and so when we look at these clouds right when we look over here they're super super wide but the other thing that we notice about these clouds is they're also flat right what's that all about well interestingly enough these flat sections on the clouds will often times line up all right with Fibonacci okay so oh my tin foil hat just fell off so when you see these flat sections on the clouds often times they will line up with macro Fibonacci levels so in this instance here right let me just get rid of this so in this in instance here right this upper Cloud right here if you pull a fib from that high down to this low retracement right interestingly enough again the cloud lines up right with where your golden pocket is then this little lower section here was where your macro 236 at it's where your macro .5 sat is where your macro 382 sat once again Fibonacci is lining right up at these levels and then back down here your 0.5 Fibonacci and then you've also got your 236 here if we just drag this across you guys can see 236 right there so often times right ichimoku right the reason that people like this so much is rather than having to and again I know this is going to sound [ __ ] hilarious but rather than having to put in all of the work of drawing all the stuff and D you can just turn on that indicator you can see pretty clear kind of FIB lines and resistance that are above you might not know I'll say specifically what Fibonacci they are but you know that there's resistance above at those areas right and then if you're trading Fibonacci often times what we look for
7:27as Traders if we are looking for breakouts or potential moves right is when these clouds thin out in the future because when they thin out in the future price action then does not have to work as hard to break through these zones or these areas right and so when price action right when these clouds give us these little openings like this in the future it suggests that price action in the future has the potential to break through that little section right because it doesn't require as much volume as moment uh as much momentum and as much velocity to get through that as it does through something like this and something like this and you can actually see that uh reflected in the last couple of times in price action right so gme ichimoku Cloud super super super red but it gets through it right and then when it starts breaking down the cloud really thinned out you stayed underneath it then the cloud was green but look at how flat it was here right signaling that there was some resistance levels here now I'm willing to bet if we pull a fib from to right there right not really I don't really see anything too interesting in there I wonder if I pull one from up here no not even okay anyway sorry then you can see that price action is staying underneath these clouds right using it as resistance and so when we were trading this in this nine weeks of hell right one of the reasons that we started to get excited on this bounce right here is because we were like look at the cloud the Cloud split open there's a huge huge huge open area of space for price to just explode through if this is the breakout move unfortunately it just ran right into it smacked it right down and then just before earnings that cloud really opened up and then we got [ __ ] destroyed into Valhalla but once we got destroyed down to this $10 range and we started bouncing up look at what happened to the clouds again they thinned out and it opened up the skies for games stop price action to break through it and what did we do big candle big volume big velocity boom boom boom right on through it then we
9:32used old resistance turned it into new support and then exploded off of that so you can imagine why when we look at the indicator here on gme with the ichimoku clouds right the future has opened up the skies for us right towards the basically the beginning of November it has opened up the area for us to make explosive moves through if GameStop continues to remain bullish right now we know that based on this indicator there is going to be hard resistance at $22 and then we know that we have our two little moving averages sitting right here right at about 21 and 2150 so we know that if GameStop stays underneath 22 to 2150 we're in trouble because that cloud will then start to Fan out and start to get big as the volatility starts to pick up and and if price fails to break through that and that cloud starts to widen up big and red and we are not on the positive side of it right you can anticipate that there will be a push down right in the very same way that we did here right these Cloud these clouds thinned out way up here and we had no chance of getting through them and then once we hit this peak and we rejected these moving averages or these uh just call I'll call moving averages for the sake of it right we re to these moving averages look at that cloud how it started to just expand in a big nasty meaningful way we had no chance of breaking out during this whole period of time because that L listen every time the cloud has been that [ __ ] thick and red you have been in really big trouble like it has not been generally positive right so you can imagine why like this area price action has been so [ __ ] but like look at how the volatility is just disappearing and price is tightening and we can see that displayed both on price and in the clouds so over the next couple of weeks like it's thin and we've got opportunity to break through this thing it's just going to be a matter of do we have the Bulls do we have the buyers do we have the momentum do we have everything that we need to
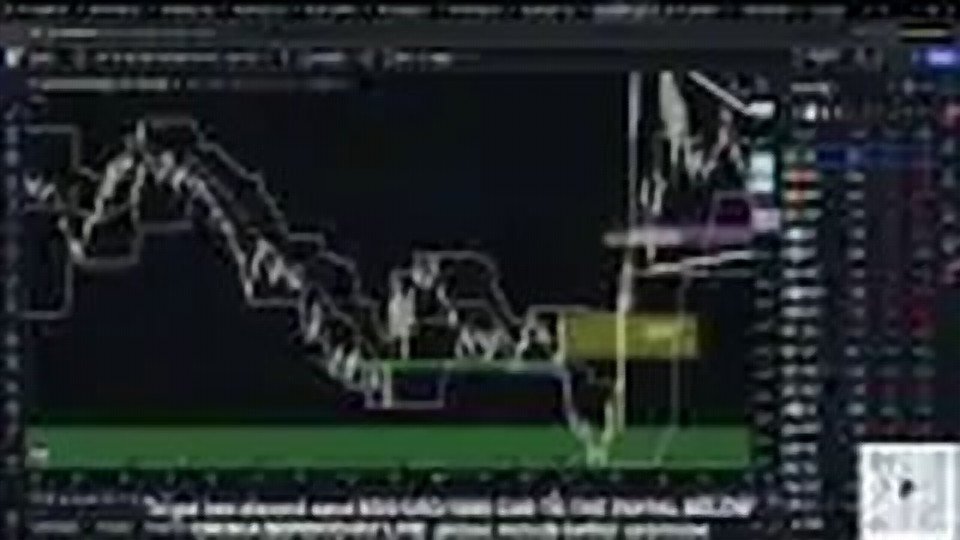
11:46push these things through but this particular indicator right can identify not just support not just resistance right but it can give you signals it can give you potential openings on where you could anticipate or expect a potential breakout right lots of different and unique ways to use this indicator right and the cool thing is once you kind of start to understand this indicator you will kind of start to understand some of the other ones that are involved with this such as the Donan channels right because the Donan channels are a really fantastic indicator these are just like the Ballinger bands okay these are identical to the Ballinger bands in the sense that if you were above the center it is considered bullish and if you were below the center it is considered bearish but I'm going to teach you something about these that are really [ __ ] unique that a lot of people don't talk about on these things okay now you guys can see on these Donan channels right you guys can see on these Donan channels that they make very flat tops very flat bottoms right it's not like the Ballinger bands where these things kind of move like in and out like this right these channels are very flat right any anybody disagree with me about that or you you guys good with that so far I want to make sure that you guys see this because this is an important part right here you when you guys understand this indicator right here this is going to help you trade right this is just an indicator that I haven't really spoken about before it's a little bit more complex to understand but I promise you guys if you understand this things will start to make a little bit more sense in terms of support and resistance okay so check this out okay Donan channels encapsulate price right you guys can see that clear as day on the chart Donan channels price rarely ever goes outside of them right look look at look at Price action here just on your guys' screens right look at Price action just on your screens the Donan channels and price action price has been inside of them 99.9% of the time right so being that they've been in here 99.9% of the time right what you
14:08have to do with the Donan channels is pay attention to the highs and the lows and those flat lines that are created now why are they important okay I want you to look at this okay this range of price action here okay now oh check this out okay price action comes up makes this move right and then it Wicks into this high right here and when it Wicks into this high this Donan Channel upper band remains dead flat right it goes dead flat for multiple multiple weeks right and then when price action rejects this upper band comes down here right and then you have this lower band right here right this lower band of the doning challs right here now I'm going to do something here we're going to draw a trend line right across from it okay now this is why I talk about body candle closes and body candle opens all the [ __ ] time because this indicator taught me everything I ever need to know about it when you have candles that have body closes either above or below the Donan Channel lines right so we marked off this flat line right here right in white and when we had a body candle that closed underneath it the Donan Channel moved and often times when you have the Donan channels when those bands are flat and price closes below the flat level that was established price will then make the move and push those channels so you can see in this instance that price has a body candle close outside of the low of this line right here and when that body candle closed it led to the significant push down which led to those Donan channels break breaking down and the same thing happens on the upside here look right Donan channel is flat right here right body candle closes above it price pushes up right same thing right here price Wicks into this low creates this flat level you don't have a candle that closes underneath that flat level and then price finds a healthy and significant bounce and then using this little stair step of price action right here this is a premium example right you Wick this low create this flat line body candle close underneath it price pushes down then it creates this flat line body
17:11candle close underneath it price pushes down then it creates this Flatline body candle close underneath it price has temporary push up before it then ultimately pushes back down often times when you have the body candle closing either underneath or above that upper or lower Donan channel line it is a signal that price wants to move up or down from out of that range so like gme here in the most recent price action right gme in the most recent price action right check this out we drew a line here right because this was like our most recent flat section and you did not have a candle that closed above that trend line that's why we have not gone higher same thing on the downside right you draw a trend line on the low side of that Donan Channel you have not had a candle that has closed underneath that lower trend line and that's why we have stayed in between those two trend lines and this particular price range doesn't have to be rocket science right is it isn't it beautiful right and then look at what happened when the when the sneeze right when the cat squeeze start to happen right we established this very flat Trend range and then you had candle close above it that led to the Donan Channel rising and then we had this Flatline then you had a candle close above it and bye-bye right these things are not coincidental they just aren't it's technical analysis and the more that people become comfortable using technical analysis whether it's ichimoku clouds or donin channels or Ballinger bands or moving averages or RSI right I just show all of you guys these indicators and it's not it's not to confuse you or to give you too much information but ultimately you will find something that you like that works for you and if you find something that likes that you like that works for you then use it right use it all of the time but the ichimoku clouds are a really nice indicator they are complex right there's there's no doubts about it that it is complex but the more order that you start to understand how that particular indicator can show you bullishness and bearishness in the moment while also showing you potential breakout zones and times in which these
19:39things could take place right you can see how you can use an indicator like this without having to have 10,000 different things on your chart so I hope you guys found that uh donian Channel and ichimoku Cloud session uh helpful and hopefully you can use that going forward to your advantage